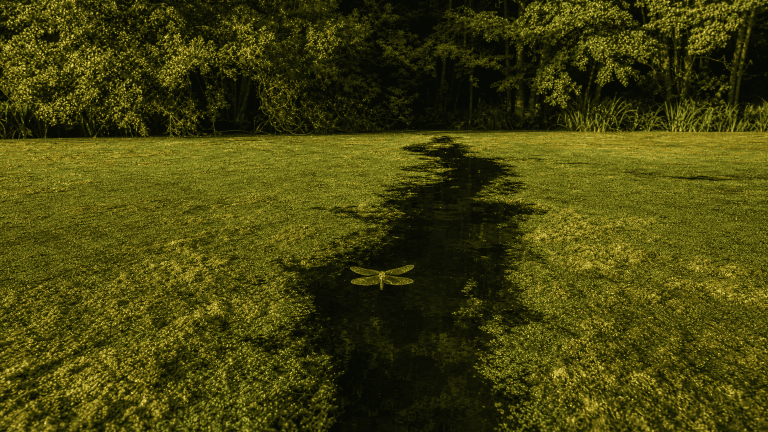
You drove four hours for the salmonfly hatch and got there for the week after it.
Or the week before, which is worse, because at least the week after has fish that remember. The chart said the first two weeks of June. The chart wasn’t lying. It was describing an average of years with heavy snowpacks and light ones, cold Mays and warm ones, and then confidently splitting the difference.
What the insects are actually responding to
Two main things, and they behave very differently.
Photoperiod — day length — is fixed. It’s identical every year on the same date at the same latitude. It’s part of what cues a lot of aquatic insects toward emergence, and it’s the reason hatches happen in roughly the right season at all.
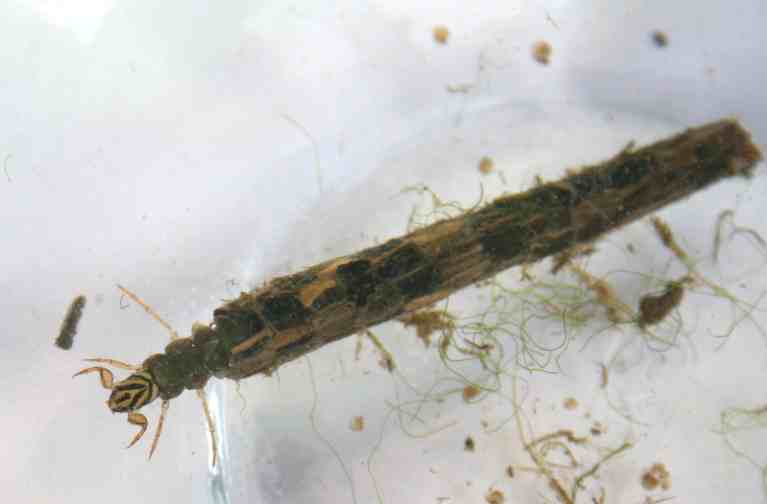
Water temperature is the trigger and the accelerator. Nymph development rates depend on accumulated warmth. A cold spring means slower development and later emergence. A warm one pushes everything forward. On a given day, temperature is also part of what determines whether a hatch comes off at eleven in the morning or four in the afternoon.
Day length says approximately when. Water temperature says exactly when, and water temperature isn’t the same in two consecutive Mays.
Which is why the chart is off in a predictable direction
A cold, high-water spring runs things late. A warm, low-water one runs them early. A big snowpack that comes off slowly holds a river cold into June and pushes everything back; a low snowpack that melts fast gets it warm early and moves everything up.
That’s not random noise, it’s a signal you can read from the road. Snowpack numbers, streamflow gauges and current water temperature are all published, and any of them will tell you more about this season’s timing than a chart will.
Which means you can often correct the chart before you leave. A river running well above median flow and several degrees below its usual temperature for the date is running behind, and whatever the chart promises for this week is probably next week’s event.
The elevation and latitude version
The same species emerges at different dates on different water, and the difference can be weeks.
A low-elevation river warms earlier than one at six thousand feet. A tailwater coming out of the bottom of a deep reservoir may be a nearly constant temperature year-round and run a completely different schedule from the freestone river it joins twenty miles later — sometimes the same bug, months apart.
And a spring creek fed by groundwater at a stable temperature can hatch things in February that a nearby freestone won’t produce until May.
Fishing advice changes with latitude and elevation in general, and hatch timing is one of the sharpest examples.
What to do with a chart, then
Read it as a sequence rather than a calendar.
The order is remarkably stable. Skwalas before March Browns before caddis before the golden stones before the PMDs before the tricos. That order holds in a cold year and a warm one. What moves is the start date, and when the start date moves, the whole sequence moves with it.
So the useful question isn’t “what should be hatching on June 12.” It’s “where in the sequence is this river right now,” and you answer that by finding out what came off last week. A fly shop report or a phone call is worth more than any published chart.
Then you know which entry on the chart you’re standing next to, and the chart becomes genuinely useful again as a guide to what’s coming.
Carry a thermometer, it costs almost nothing
A stream thermometer is a few dollars and it converts a lot of guessing into a number.
Not as a lookup table — the “trout feed at 55 degrees” thing is a simplification that falls apart quickly — but as a way to build your own record. Take a reading when you arrive and note what’s happening. Do that for a season and you’ll have something no chart can give you: what your water does, at what temperature, in the year you’re actually fishing.
One reading doesn’t run the day, though. The temperature in a shaded riffle at eight in the morning isn’t the river’s temperature, which is why a single reading shouldn’t dictate everything.
The part about being early or late
A hatch you miss by a week isn’t a wasted trip unless you decide it is.
Before the hatch, the nymphs are still in the river and frequently more available than usual as they get active. After it, the spinners and the leftovers keep feeding fish for days, and the fish have just had a heavy meal cycle and are still looking up.
And the fish you came for are still there and still eating. Sometimes the best dry-fly fishing starts after the mayfly hatch is over.
The thing that ruins those trips is usually not the timing. It’s arriving committed to one plan and spending the day arguing with the river about a schedule it never agreed to.
What it looks like to get this right
Check the flow gauge and the temperature, find out what came off in the last week, and slide the chart forward or back. Then go fishing with two plans instead of one.
Fifteen minutes of work, and it’s the whole difference between “the hatch was late” and “the hatch was exactly where I expected to find it.”
FIELD OBJECT
This one should leave the page.
The article is the long version. These are the pieces worth carrying into the next trip.
The 30-second version
Every hatch chart is a memory of an average year. The insects are running on water temperature and day length, and one of those two changes a lot between seasons.
What to watch
- What the insects are actually responding to
- Which is why the chart is off in a predictable direction
- The elevation and latitude version
- What to do with a chart, then
Field card
- What the insects are actually responding to
- Which is why the chart is off in a predictable direction
- The elevation and latitude version
- What to do with a chart, then
- Carry a thermometer, it costs almost nothing
RIGHT TOOL, NEXT
Hatch Match
Turn the observed food, stage, size, silhouette, and behavior into the next presentation decision.